Spatial transcriptomics is a powerful tool to create a detailed map of not just how genes are expressed in a piece of tissue, but also where genetic activity takes place in different cells and locations within the tissue. This is especially valuable for studying tumors, which each have their own unique microenvironment that affects how they behave.
Given the massive amount of data involved, however, it has been difficult to compare these data from different tumor microenvironments to spot similarities or predict how a given tumor might develop based on its composition.
A new research study from the University of Chicago tackles this challenge by applying lessons scientists have learned from other complex systems, from communities of microbes to flocks of birds. The result is a new set of tools that could someday allow clinicians to quickly analyze the structure and organization of a tumor and determine how it will respond to different treatments, a big step forward toward the goal of personalized medicine.
Tools for understanding complexity
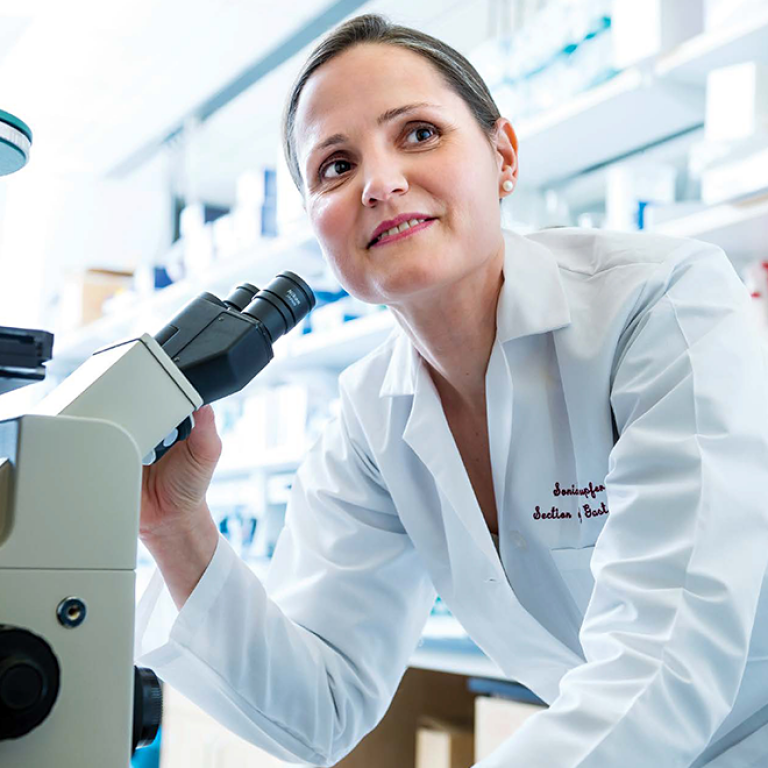
Arjun Raman, MD, PhD, Assistant Professor of Pathology at UChicago and senior author of the new paper published in Cell Reports Medicine, is a systems biologist who studies how complex systems like microbiomes and protein networks behave in the natural world. By learning the rules that helped these systems grow and evolve, one can then develop theories and tools to understand and predict how other systems change under similar conditions.
In the case of the tumor microenvironment, cells interact and organize themselves in complex ways that shape the overall activity of the tumor. Raman compared trying to understand this behavior to studying flocks of birds.
“If you look at a flock of birds, there are all these individual birds that behave in individual ways, and then they come together in the whole flock, which behaves in a collective way. Here, instead of birds, we have cells, and instead of the flock, we have the whole tumor biopsy,” he said. “What we found out was we could describe tumors not as a composition of a whole bunch of cells, but like a flock of birds, where all the cells talk to each other and then create these subunits, and then subunits interact with each other to create meta subunits, and so on and so forth until you get the whole biopsy sample.”

Arjun Raman, MD PhD
Assistant Professor of Pathology
Committee on Genetics, Genomics and Systems Biology
Using these same principles for understanding emergent complexity, Raman and his colleagues studied spatial transcriptomic data that has been published on 262 solid tumors and then developed statistical formulas to describe how tumor cells and their genetic activity are organized within the microenvironment. To use another analogy, it’s like they created a detailed floor plan of a home for each tumor. Some cells and their genes cluster in one “room,” and some cells and genes gather in others (the researchers call these rooms “spatial groups”).
Comparing floor plans
These floor plans provided a kind of common language, with measurable dimensions that Raman and his team could now use to compare tumors using new AI tools. “Before this, there was no way to compare two floor plans. There is so much data in each one that there was no clean way of saying this is what's similar versus this is what's different,” he said. “Now we have the tools to evaluate how far floor plan one is from floor plan two. You can calculate a distance metric between them and see how similar they are.”
The ability to compare becomes important to cancer treatment if physicians know that a tumor with floor plan one responds well to a treatment, but floor plan two does not. Raman tested this out by working with lung cancer specialist Marina Garassino, MD, Professor of Medicine at UChicago. Garassino’s lab provided 16 tumor samples from patients with non-small cell lung cancer, along with clinical data about how they responded to immunotherapy.
Raman’s team was able to analyze data from these and more than 200 other tumors and found that tumors generally share a stereotyped, hierarchical structure made of the spatial groups. They then were able to compare tumors to each other, not at the level of their cell populations or genes, but at the level of spatial groups – a description that took into account how different tumors were from the perspective of their spatial biology.
Performing this comparison allowed the team to make a comparative “latent space” – a type of space used in AI frameworks where objects are placed close or far away based on their statistical similarity. This type of description ended up correctly predicting which non-small cell lung cancer patients ultimately went on to respond to immunotherapy better than the current standard-of-care biomarker.